By Ed Ring, Ecoworld
EcoWorld: How would you say that current conventional wisdom regarding climate change has gotten it wrong?
Pielke: In terms of climate change and variability on the regional and local scale, the Intergovernmental Panel on Climate Change (IPCC) reports, the Climate Change Science Program (CCSP) report on surface and tropospheric temperature trends, and the U.S. National Assessment [of Climate Change] have overstated the role of the radiative effect of the anthropogenic increase of carbon dioxide (CO2) in relation to a diversity of other human climate- forcing mechanisms. Indeed, many research studies incorrectly oversimplify climate change by characterizing it as being dominated by the radiative effect of human-added CO2. But while prudence suggests that we work to minimize our disturbance of the climate system (since we don’t fully understand it), by focusing on just one subset of forcing mechanisms, we end up seriously misleading policymakers as to the most effective way of dealing with our social and environmental vulnerability in the context of the entire spectrum of environmental risks and other threats we face today. For full interview go here.
Roger Pielke Sr. is a retired professor of atmospheric science at Colorado State University, Ft. Collins, and a senior research scientist at the University of Colorado, Boulder. Since July 2005 he has written and maintained Climate Science, a blog that serves as a scientific forum for dialogue and commentary on climate issues. With William R. Cotton, he is the co-author of Human Impacts on Weather and Climate (Cambridge University Press, 2007).
By Joseph D’Aleo, CCM
A new study funded by the Pew Charitable Trusts and conducted by the Vermont Public Research and Education Fund purports to show increased extreme precipitation events—rain and snow—in the United States over the last 59 years, perhaps linked to global warming. It has gained a lot of attention in the states where frequency of such events is reported to have increased substantially, including Vermont, with news stories noting that it was reviewed by two climate scientists, Kenneth Kunkel of the Illinois State Water Survey, and David Easterling of the U.S. Climatic Data Center (both excellent climatologists).
1948 was chosen as a starting point for the study. This ironically was at the beginning of the last cold phase of the Pacific Decadal Oscillation, a multidecadal flip flop in ocean temperatures over the entire North Pacific Basin. This cold phase lasted until 1977 when it transitioned to the warm phase which dominated the last half of the study period. This is important because the PDO has a major influence on the frequency of El Ninos and La Ninas and through them the favored storm tracks and thus precipitation. Thus the regime changed from the first half to last half of the chosen period.
This period dependent result is similar to the often referenced but flawed work by Mote (BAMS 2005) which showed a decline in western snowpack from 1950 to 2000, again reflecting PDO shifting storm tracks and NOT greenhouse warming. His own assistant stated that had the study started earlier in the century, no trend would have been found. That cost him his job.
Ironically Easterling himself was a coauthor of a study of precipitation changes between 1895 and 2000 across the United States published in Geophysical Research Letters in 2003 that found the “frequencies at the beginning of the 20th Century were nearly as high as during the late 20th Century for some combinations of duration and return period, suggesting that natural variability cannot be discounted as an important contributor to the recent high values.” Read more here.
By Gaius in Blue Crab Boulevard
15,000 politicians, bureaucrats, lobbyists, activists, journalists and other assorted celebrities, hangers-on and others have descended on Nusa Dua, Bali in Indonesia to discuss global warming.
Over the course of the eleven-day meeting, these people will discuss how to limit carbon emissions. These same people will generate an estimated 100,000 tons of carbon dioxide in travel to and from the conference and lord knows how much energy and consumables while they are there. Many of those consumables will, of course, have to be shipped to Nusa Dua, adding substantially to the carbon footprint of the gargantuan meeting. They’ll be staying in magnificent resorts and hotels. Pictures show that Nusa Dua is a veritable paradise, it is according to their tourism people and a magnet for the jet set from all over.
So, while these functionaries plot out how to limit your lives, how to immensely increase the cost of your energy, how to redistribute your wealth on a global scale, they will not be doing so in anything less than plutocratic splendor that emperors of even a century ago could not have dreamed of. But don’t worry. They are doing it for all the best reasons. Trust them. They’ll wave from the limousines. Read more here.
New Early Season Snow Records Set Across the North
Early seasosn arctic cold brought heavy snows this past few days across the north, setting records in places. The CBC reports the ”Montreal cleanup underway after record early snowfall”. A record 31.6 centimetres (12 inches) of snow fell on Montreal Monday, more than double the previous Dec. 3 record of 14 centimetres, and it will take a week to clean up. More than 3,000 workers hit the streets of the city Tuesday morning to start clearing away the snow, which continues to fall. Environment Canada predicts another two centimetres for Tuesday. The city has already spent more than $1 million coping with its first major storm of the season, and it’s estimated it will cost $17 million by the time the cleanup is completed.
Further to the south and east, Portland, Maine tied a record for the date set in 1890 Monday when 8.5 inches fell. Elsewhere, Marshfield in Washington County had 18 inches of snow, Lakeville in Penobscot County 17 inches, Island Falls in Aroostook County 16, Brassau Lake near Moosehead 15.7, Farmington 14.7 inches and Andover 13, the weather service said.
To the west in North Dakota, The National Weather Service says the Grand Forks airport had 8.1 inches of snow yesterday, setting a record for the date. And Fargo set a record with 5.9 inches. The previous mark in both cities was set back in 1926. Grand Forks and Fargo also had record snowfall last Saturday.
By Joseph D’Aleo, CCM
The now familiar plot of the US climate network since 1895 shows a cyclical pattern with a rise from 1895 to a peak near 1930 and decline into the 1970s and then another rise with an apparent peak around 2000. Note the minor warming from the peak in 1930 to the peak in 2000.
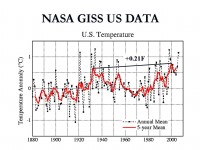
The short term fluctuations are driven by factors such as ENSO and volcanic eruptions. The longer term cycles are mainly driven by cycles in the sun and oceans although changes in the last half century have been increasingly blamed on anthropogenic factors. Let’s look at the three longer term factors mentioned and how well they atcually correlated with the observed temperatures.
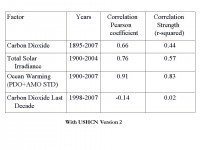
See full size table here.
Clearly the US annul temperatures over the last century have correlated far better with cycles in the sun and oceans than carbon dioxide. Whatsmore, this correlation with carbon dioxide seems to be weakening further in the last decade. Read full details about how this analysis was done here.
Guest Blog from Dr. Madhav Khandekar
If you are following the Canadian weather patterns, the Prairies are in DEEP FREEZE and I recall my Edmonton days from Spring 1971 thru December 1974. In January 1972 I remember one week then when temperatures were in the range -35 to -45C all thru the week! This is what is happening there right now. For example, Winnipeg today had a wind chill of -30C , real temperature about -20C, Regina -25C. Two days ago Regina had a parade for their football team winning the Grey Cup (equivalent of your Super Bowl) and fans were out in the street when temp was about -20C and wind chill -30C! You have to be a real football fan to be out in such a brutal weather!
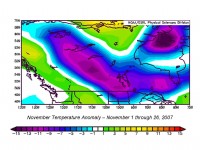
Temperature Anomalies (degrees C) thanks to NOAA CDC November 1-26, 2007. For larger image go here.
This is shaping into one of the strong La NIna phase with SSTs in Nino (1+2) region very low and also elsewhere in Nino 3 & 3.4 region. I expect this winter to be quite cold over the Prairies and with some luck we will have cooler winter on the Great Lakes vicinity in southern Ontario as well. So far the central Ontario and lake districts (Sudbury, Parry Sound, Muskoka) have had a fair amount of snow, frequent snowsqualls and ski activity already started. I recall a document prepared by one of the former Environment Canada advisor Henry Hengeveld in early 1980s with a bold prediction that “ski activity in southern and central Ontario would vanish in 25 yrs (by 2000-2005) because of lack of snow due to global waming!” The reality is far from that prediction, snow accumulation has in fact increased in southern and central Ontario in the last few years.
Madhav Khandekar specializes in understanding extreme weather events in Canada and in other parts of the world. He holds a B.Sc. in Mathematics and Physics, a M.Sc. in Statistics from India (Pune University) as well as both M.Sc. and Ph.D. degrees in Meteorology from Florida State University.
Guest Blog by David Evans, Science Speak
Our scientific understanding of global warming has gone through three stages:
1. 1985 – 2003. Old ice core data led us strongly suspect that CO2 causes global warming.
2. 2003 – 2007. New ice core data eliminated previous reason for suspecting CO2. No evidence to suspect or exonerate CO2.
3. From Aug 2007: Know for sure that greenhouse is not causing global warming. CO2 no longer a suspect.
The paper discusses how the ice core changes, missing greenhouse signature in the real data and the recent waning of the warming all suggest that carbon emissions are not behind the changes we have experienced in recent decades.
See larger image here.
The IPCC 2007 report (the latest and greatest from the IPCC) is based on all scientific literature up to mid 2006. The Bali Conference is the bureaucratic response to that report. Too bad that the data has changed since then! See the full paper here.
David Evans, a mathematician, and a computer and electrical engineer, is head of Science Speak. David is also a former believer in man-made warming who converted to skeptic.
By Joseph D’Aleo, CCM
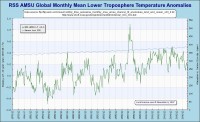
Temperature peaked in 1998 and have shown no warming for a decade now. Many scientists have been remarking about this trend for several years but no one takes heed, preferring to believe models than actual data. Here is the satellite derived global temperature trend since 1979. Note the cooling globally near the volcanically active periods of the early 1980s and 1990s. Note also the warm spike associated with the super El Nino that seemingly marked the beginning of the end of the warm Pacific trend that began in 1978.
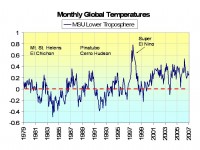
Note the subsequent cooling as a series of 3 La Ninas in 4 years helped cool the earth in the late 1990s. Temperatures rebounded a bit in the early 2000s with a slight rebound in the Pacific warmth, three El Ninos and a volcanic aerosol-free stratosphere, but the trend since 2001 has been flat and at a level considerably below the peak of 1998. This lack of warming has occurred despite the increases in carbon dioxide.
Indeed, when comparing this satellite derived temperature trend the last decade with the carbon dioxide increases as seasonally adjusted from Scripps, we find NO CORRELATION (just 0.07 r squared!!!)
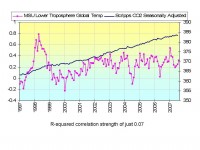
See larger image here.
Global warming is over. Man was never responsible. See full blog here.
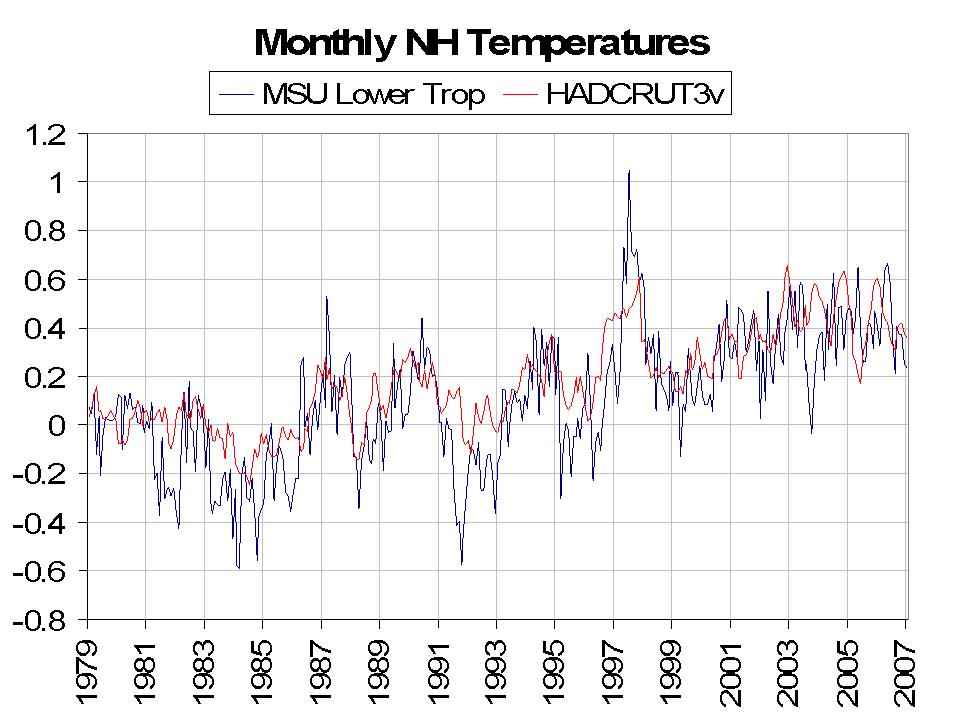
A USATODAY story claimed that the temperatures for 2007 for the Northern Hemisphere may be the warmest on record. Satellite and hemispheric station and ocean data from the Hadley Center updated through October 2007 say that has not been the case, and given the very cold weather in the cards for at least the first half of December (despite the warm NOAA December forecast), that will not change before the New Year. You can see that clearly by looking at the plotted monthly satellite lower tropospheric and UK Hadley Center Northern Hemispheric anomalies.
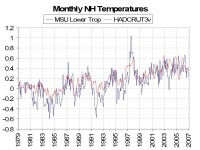
Monthly Northern Hemispheric temperature anomalies since 1979 from MSU satellite for the lower troposphere (blue) and Hadley Center combined land and marine temperature anomalies on a 5° by 5° grid-box basis (red). Click here for larger image.
See in this story how the changes coincided with major shifts in the phases of the Pacific Decadal Oscillation with the peak warmth at the end of the last warm phase. The recent cooling of the Pacific together with the looming solar decline warrant concern that temperatures have indeed peaked and a cooling either has begun or will soon begin and accelerate. A major cooling of the earth portends far more problems for mankind than the benign climate we have enjoyed for the last few decades.
With the change in the Pacific, La Ninas will be more likely which suggest colder winters across Canada and the northern United States areas, where it has been especially mild in the recent decades, even when extreme cold came to parts of the east. The USATODAY story got that part correct. “U.S. winters have been milder-than-average for the past 10 years,” reports Michael Halpert, deputy director of the Climate Prediction Center. Northern states have been particularly warm. He cautions that no link can be made between this string of mild winters and man-made climate change.
By Craig James, WOOD-TV Blog
There are several possible causes for warming and cooling of the atmosphere on a global scale. Periodic astronomical cycles, such as the Milankovitch Cycles, solar variations, volcanic activity, the shift in phase of the Pacific Decadal Oscillation (PDO), the Atlantic Multidecadal Oscillation (AMO), the Arctic Oscillation (AO), plus many others certainly all play a huge role. I have written about the natural oscillation of the oceans and their affects on temperatures in several posts on this site. Of course the mainstream emphasis today is on increasing atmospheric CO2 concentrations. If I conducted a survey asking people whether the temperature rises first and then CO2 levels increase, or vice-versa, I’m sure we could all guess the prevailing opinion is that CO2 levels increase first. I think it is very important for everyone to understand, this is not the case.
I am not doubting that humans have been responsible for an increase in the atmospheric concentration of CO2 and that this CO2 increase may have contributed to some of the warming we have experienced by a process known as positive feedback. But it does seem as if the climate models overstate this positive feedback and several others such as those for water vapor. A close inspection of the temperature and CO2 records shows that the warming we see now should be much greater if CO2 was the dominate factor.
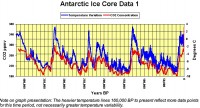
Another issue I want to emphasize has come about because of all of the concern regarding the low Arctic sea ice extent measured this fall. I can’t state this strongly enough… There is no correlation between arctic air temperatures and arctic sea ice. The air temperatures in the Arctic were warmer in 1940 than now. The sea ice extent began to diminish in 1950 as air temperatures were going DOWN. Read Craig’ full blog entry here.
By Eugenio Hackbart / MetSul Weather Center – Brazil
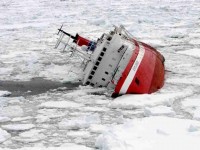
A Canadian cruise ship struck submerged ice off Antarctica and began sinking Friday, but all 154 people on board, including Americans and Britons, took to lifeboats and were plucked to safety by another cruise liner. The Explorer struck submerged ice and began taking on water through its cracked hull. Photos released by the Chilean navy showed the ship later lying nearly on its side, surrounded by floating blocks of ice. Passenger and crew were picked up by a passing Norwegian cruise ship, the Nordnorge, after several hours in eight semi-rigid lifeboats and four life rafts. “There is ice in the area. Obviously it’s a hazard’, said Susan Hayes of G.A.P. Adventures of Toronto, which owns the stricken MS Explorer. “But it’s highly unusual (that the ship would hit the ice), she told the Associated Press.
This naval disaster is no coincidence. Tours to the region became popular and the accident happens in a period market by unusual cold in the southern hemisphere. Explorer hit the iceberg in the same week that we at MetSul Weather Center reported here at ICECAP about major problems in the Brazilian Antarctic Base of Comandante Ferraz due to the excessive amount of ice and snow surrounding the installation that was preventing local researchers of getting fresh water in the nearby lakes. For months we have been reporting and commenting here at ICECAP about South America’s very harsh winter in 2007 with snowfall events and temperature averages not seen in decades. Last month, University of Illinois at Urbana-Champaign’s Polar Research Group indicated the southern hemisphere’s sea ice area reached 16.17 million square kilometers, narrowly breaking the old record of 16.03 million square kilometers. The record data goes back to 1979. Read more and see more amazing photos here.
By Joseph D’Aleo, CCM
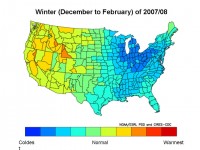
This winter as most of you have heard, we are experiencing a La Nina and that normally means on average a warm winter for most of the populous eastern and southern United States. NOAA and most private forecast services reflect this in their outlook though a few have a cold start to the winter. For the winter as a whole, most forecasts have cold air restricted to the Pacific Northwest.
In the attached we discuss why we think they may be overplaying the warm card this year. This may be one of te rare La Nina years when the pther factors conspire to suppress that eastern warmth to the deep south and make for a much colder winter where they are heavy users of energy. Not good news for consumers - individuals or businesses especially given where energy prices are already.
There will be good news finally for ski areas across the northern tier which have more years than not had rough sledding during three decades of mainly El Nino southern storm tracks.
See why we think this may be the pattern for a good chunk of the winter for the temperatures here. Note cold and snow will come at times to the northwestern and northern Rockies but will, in time, linger longest further east.
By Joseph D’Aleo, CCM
Climatologists may disagree on how much the recent global warming is natural or manmade but there is general agreement that volcanism constitutes a wildcard in climate, producing significant global scale cooling for at least a few years following a major eruption. However, there are some interesting seasonal and regional variations of the effects. Robock (2003) and others have shown that major volcanic eruptions seem to have their greatest widespread cooling effect in the summer months. In the winters, the latitude location of the volcano determines whether the winters are colder or warmer over large parts of North America and Eurasia.
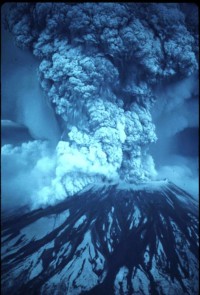
In this All About Climate paper, we will discuss these research findings but also show how unusually low volcanic aerosol activity after a long period without a major volcano as we are experiencing currently, produces a global warming with greatest warming in polar regions and northern hemisphere continents.
Annual Temperatures when Stratospheric Aerosols are high (left) and low (right). See larger image here.
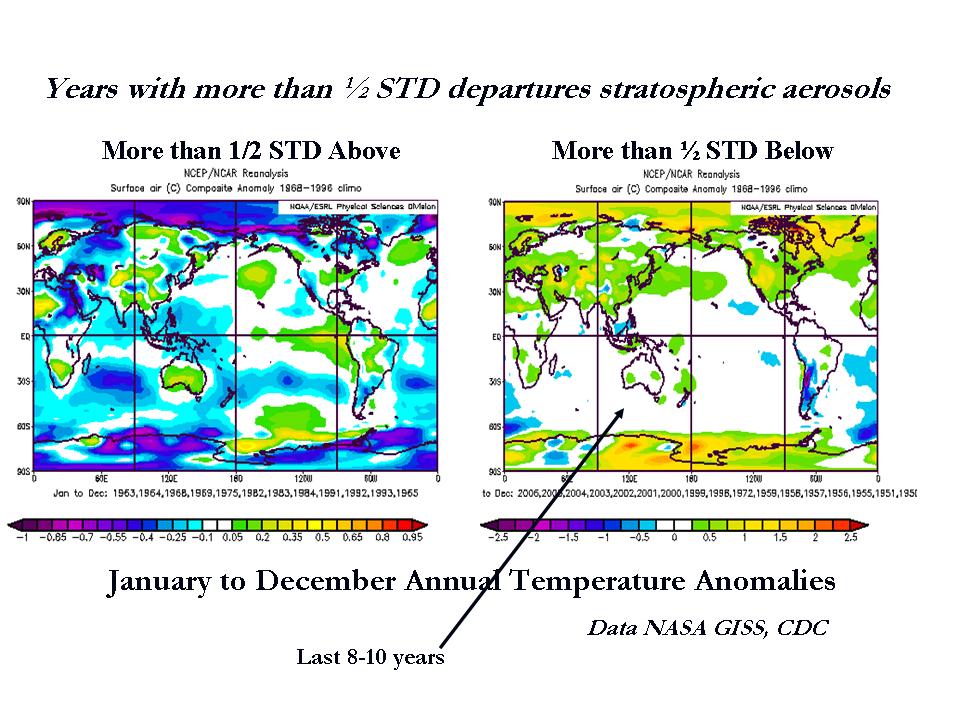
Annual Temperatures when Stratospheric Aerosol content is high as after a major volcano(s) (left) and low (right). Composites are for years where standardized globally averaged aerosol levels exceed 1/2 STD above or below long term average
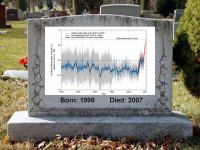
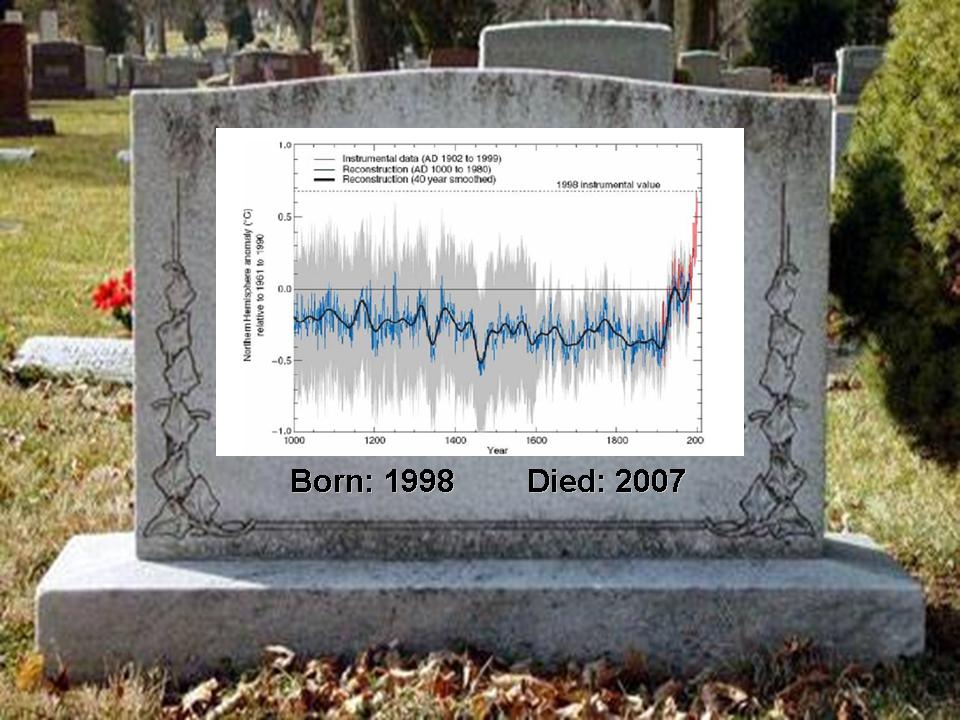
Steve McIntyre of Climate Audit continues a series of excellent posts reviewing the latest futile attempts to revive the hockey stick. Go back to September 29th to see his review of the whole UCAR, Ammann Wahl debacle.
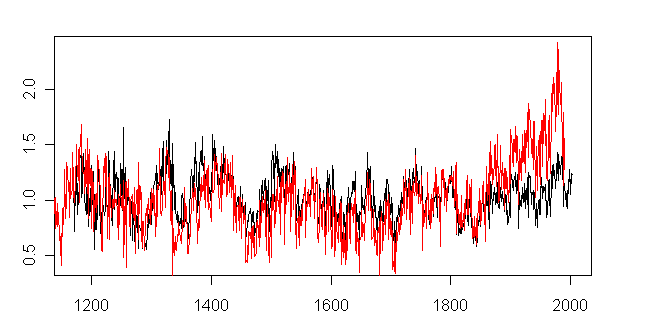
In the post on Sheep Mountain he uses the data from a University of Arizona Ph.D. thesis by Linah Ababneh (one of the reviewers of which was Hughes, one of the authors of the original MBH 1998 Hockey stick paper) to show drastically different results from the original work from the same mountain that data cores were extracted by Graybill and heavily weighted in the original MBH analysis. Scroll back through Steve prolific posts to fill in the blanks.

Sheep Mountain (Bristlecone) Chronologies Black - Ababneh 2006; red - Graybill 1987
Since the first challenges to the hockey stick by MCintyre and McKitrick, there have been many attempts by the close-knit team of paleoclimatologists to breath life back into the hockey stick and save face for Mann but their approaches all suffer from the same fatal flaws of the original work. The new analysis by Ababneh with a much greater number of cores from Sheep Mountain and the excellent compilation of world wide peer review papers showing the Medieval Warm Period was real at CO2Science should allow the ‘hockey stick’ to finally rest in peace.
By Joseph D’Aleo, CCM
Back in 1977, the Pacific Ocean underwent a major transformation that was called the Great Pacific Climate Shift. Suddenly warm water replaced cold water that had dominated for most of the prior three decades near the west coast of North America and along the equatorial eastern Pacific. In 1997, researchers at the University of Washington in a paper in the Bulletin of the American Meteorological Society reported they had discovered a multidecadal oscillation in Pacific sea surface temperature and pressure while trying to explain decadal changes in salmon fishery production. They called it the Pacific Decadal Oscillation. They noted that major shift that had taken place in 1977 was a change in the PDO from what they termed the cold phase to the warm phase.
In the warm mode with warm water favored in the eastern tropical Pacific, El Ninos were favored over La Ninas and indeed since 1977 there have been more frequent and stronger El Ninos that have helped contribute to global warming.
Starting in the late 1990s a shift to the cool mode began but it was halted in the early 2000s. This year with the help of a developing relatively strong La Nina, the cool mode is again increasing.
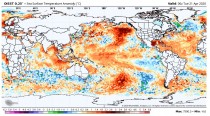
Current sea surface Temperature anomalies (blue colder than normal, yellows and red warmer)
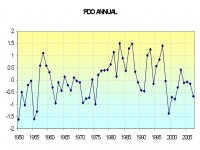
Annual mean PDO from 1950 to 2007
If that change to the cold PDO is this time a lasting one (and given past intervals of warm and cold which typically averaged 20 to 30 years, it certainly appears very possible), we may be entering a new era with more La Ninas and a very different climate, especially if the sun goes into its usual 200 year deep sleep as more and more solar scientists are beginning to believe will happen. Read the likely outcome of such a Pacific ocean change here.


